Dashboard
The goal of the dashboard is to show actionable information about the test health of the repository.
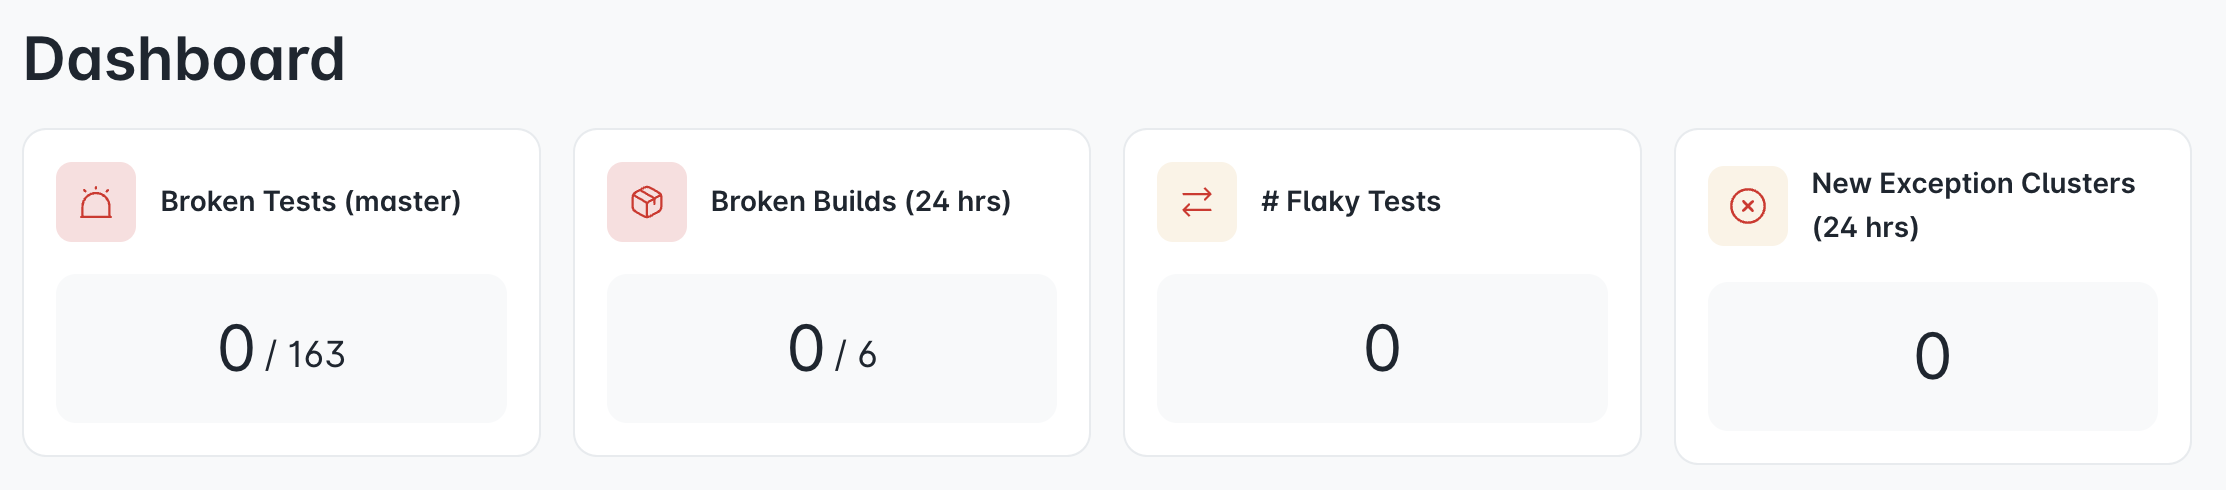
Quick stats
The quick stats bar shows:
- The number of currently broken tests
- The number of broken master builds in the past 24 hours
- The number of currently flaky tests
- The number of new exceptions thrown by the tests in the past 24 hours
Summary
The charts indicate current trends in the tests. We currently show:
- The number of broken and flaky tests a day
- Pull requests with and without tests
- Coverage by different test types
- Average duration of test execution
TODO: Add a nice summary photo here!